Unruly Media released a Viral Spiral interactive infographic that tracks views and shares of branded online videos from 2006 to the present.
infographic
-
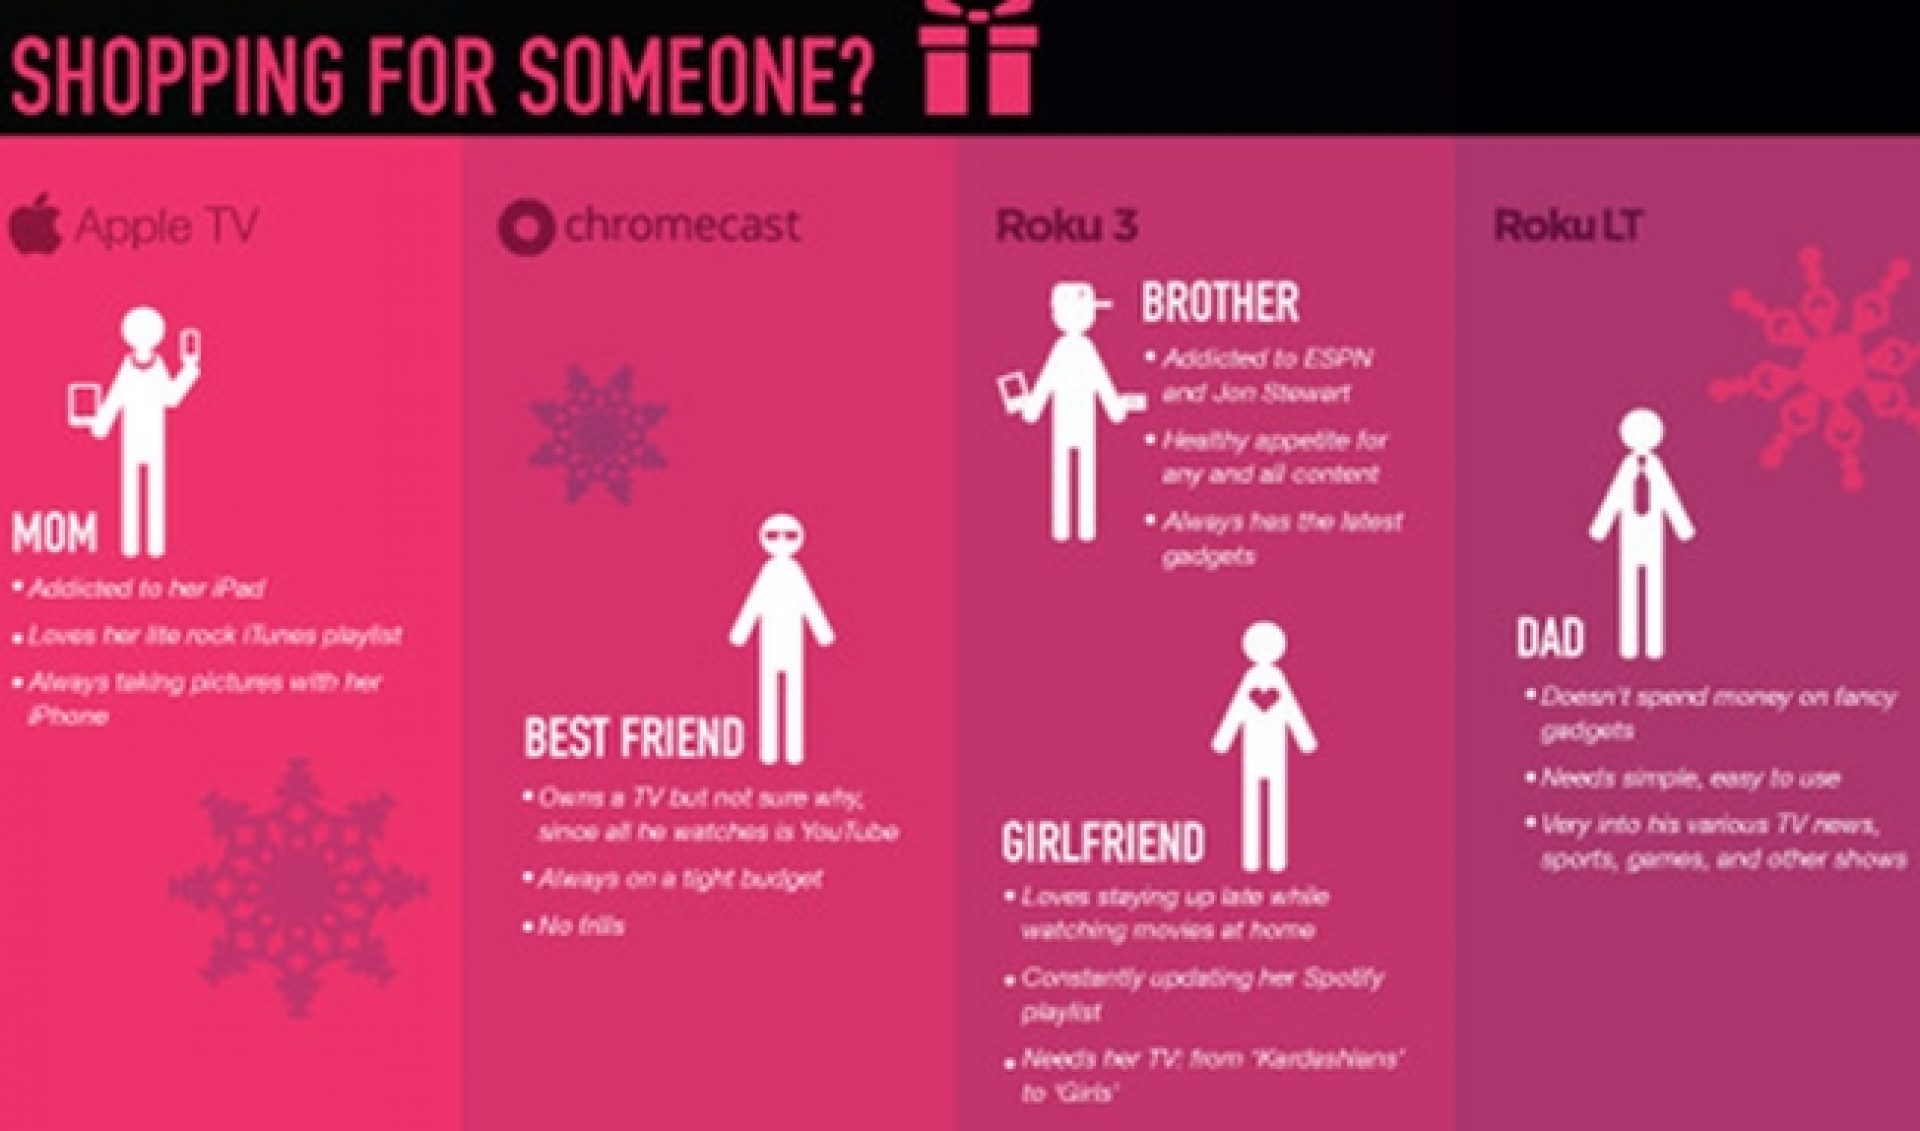
This Infographic Helps Choose The Best Web-To-TV Device For You

-
This Interactive Infographic Shows The History Of Branded Online Video
-
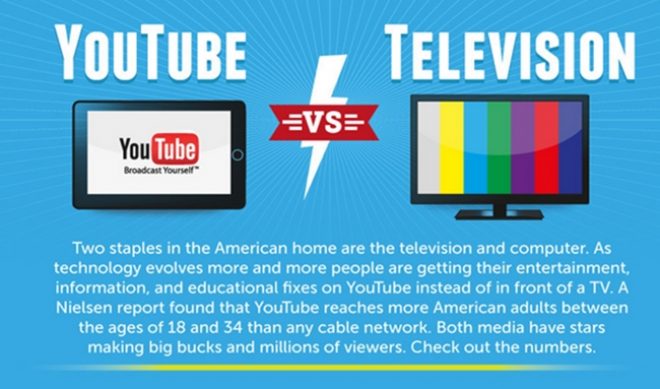
Infographic: Average American Watches 5.3 Times More TV Than YouTube
An infographic created by the YouTube Downloader blog reveals that TV programs still receive 5.3 times as much watch time as YouTube videos.
-
By 2015, 90% Of Web Video Consumption Will Come From 18-34 Demographic
A video infographic from Getty Images' iStock notes that, by 2015, 90% of all online video consumption will come from the 18-34 demographic.
-
Here’s What Goes Into a $1,339,558 Web Series [INFOGRAPHIC]
-
China and Brazil Leading Global Expansion Of Online Video
-
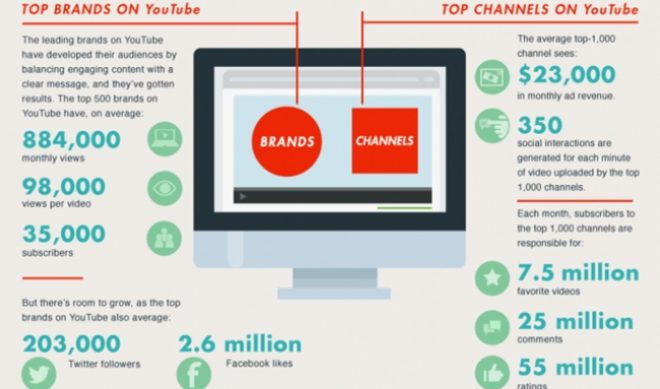
Top 1000 YouTube Channels Average $23,000 Monthly Ad Revenue
-
Infographic Shows How User-Generated Content Is A Brand’s Best Friend
-
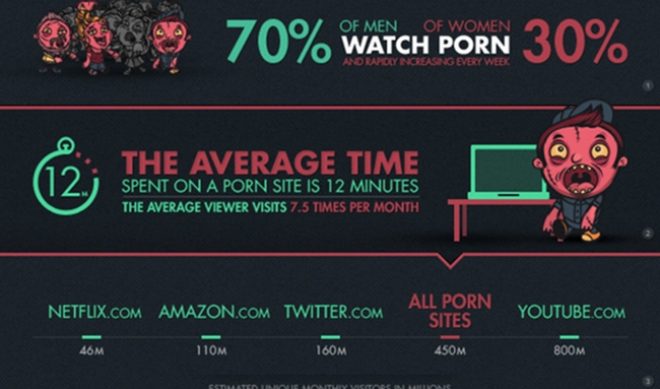
Porn Sites Scoring Over 450 Million Uniques A Month
-
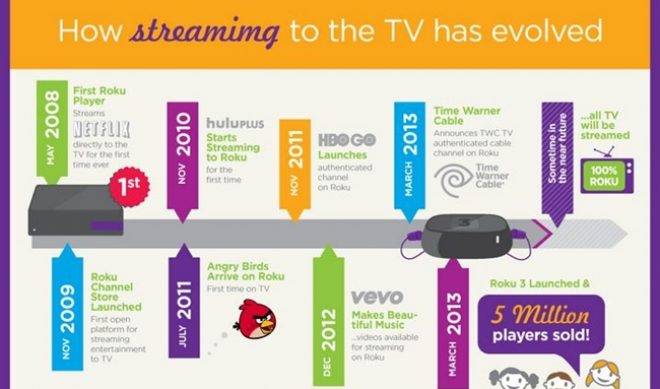
With 5 Million Devices Sold, Roku Adds Time Warner Channels
-
How The Budget Of A $636,010 Web Series Breaks Down
-
Red Bull, Google Declared Top Companies For Branded Social Video


![Here’s What Goes Into a $1,339,558 Web Series [INFOGRAPHIC]](https://www.tubefilter.com/wp-content/uploads/2013/07/video-game-high-school-infographic-660x389.jpg)


Newsletter
Subscribe for daily Tubefilter Top Stories
Trending Stories
- After viewer backlash, Watcher’s content is staying on YouTube. But the studio says it’s struggling.
- William Osman’s STEM convention Open Sauce returns for second year, will feature 150 content creators
- TikTok announces 18+ live streams for content that needs to be “limited to adults”
- Noah Beck talks love, life, and Iphis in first episode of new digital series ‘Marshall Will Pick You Up’
- Millionaires: For the SaucyTV family, “YouTube is the greatest canvas”


Tubefilter, Inc


© Copyright 2007 - 2024 Tubefilter, Inc.