Unruly Media released a Viral Spiral interactive infographic that tracks views and shares of branded online videos from 2006 to the present.
infographic
-
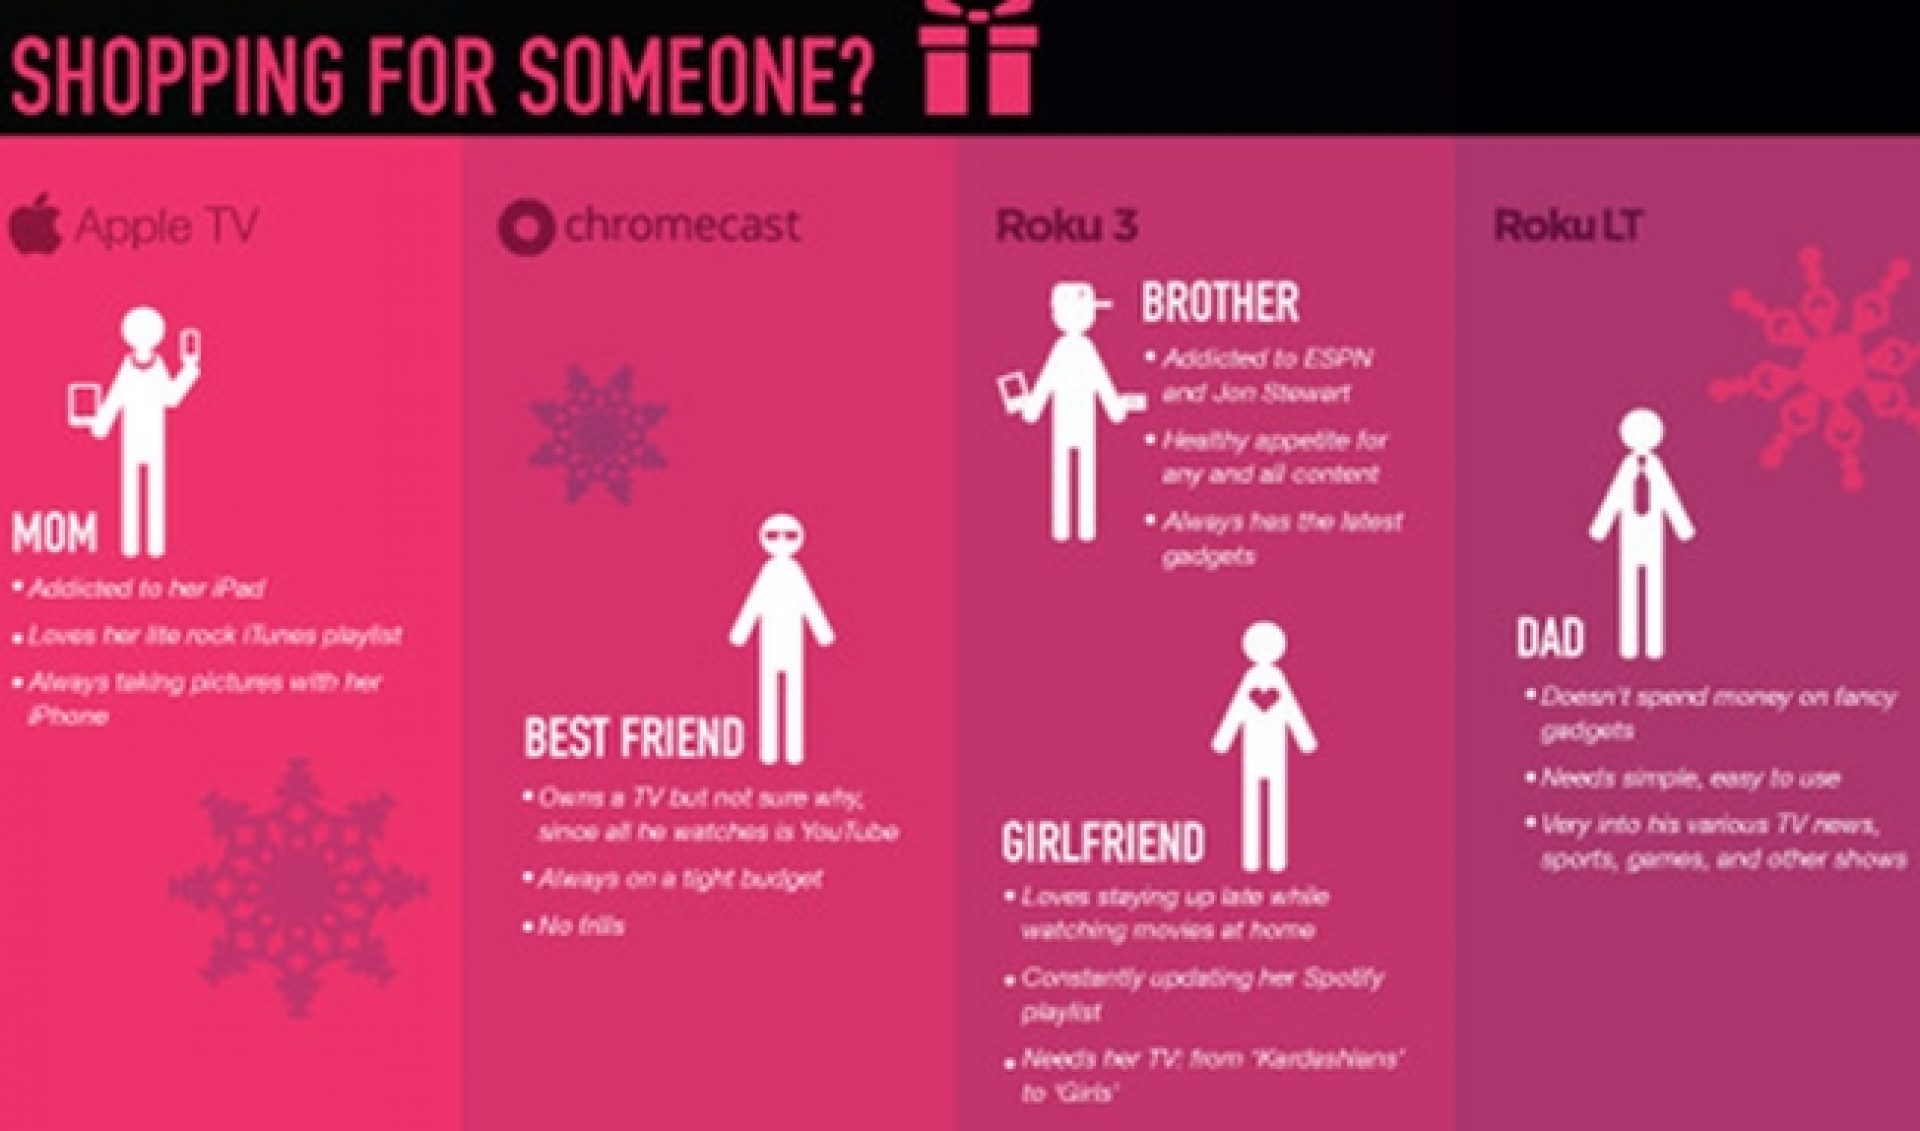
This Infographic Helps Choose The Best Web-To-TV Device For You

-
This Interactive Infographic Shows The History Of Branded Online Video
-
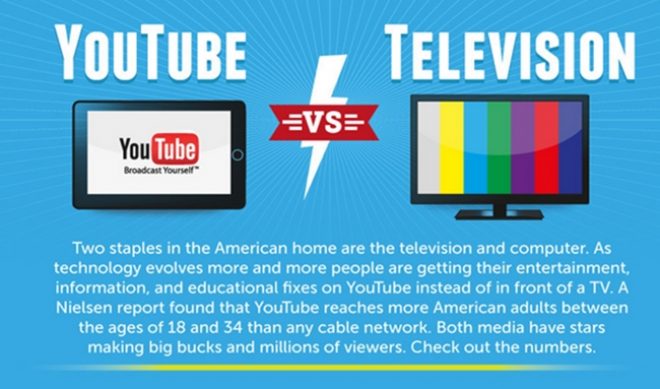
Infographic: Average American Watches 5.3 Times More TV Than YouTube
An infographic created by the YouTube Downloader blog reveals that TV programs still receive 5.3 times as much watch time as YouTube videos.
-
By 2015, 90% Of Web Video Consumption Will Come From 18-34 Demographic
A video infographic from Getty Images' iStock notes that, by 2015, 90% of all online video consumption will come from the 18-34 demographic.
-
Here’s What Goes Into a $1,339,558 Web Series [INFOGRAPHIC]
-
China and Brazil Leading Global Expansion Of Online Video
-
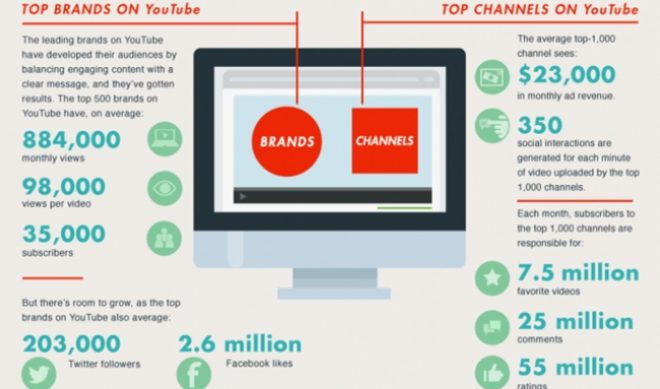
Top 1000 YouTube Channels Average $23,000 Monthly Ad Revenue
-
Infographic Shows How User-Generated Content Is A Brand’s Best Friend
-
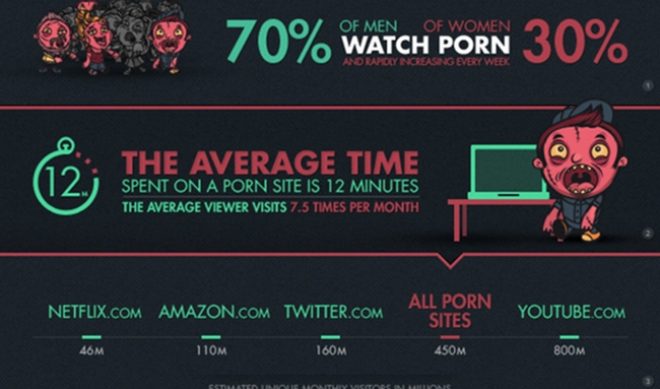
Porn Sites Scoring Over 450 Million Uniques A Month
-
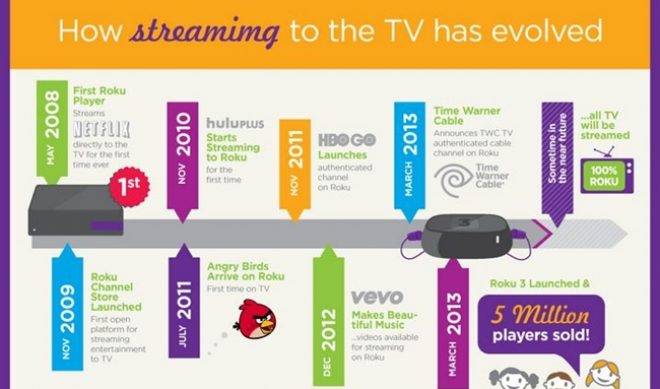
With 5 Million Devices Sold, Roku Adds Time Warner Channels
-
How The Budget Of A $636,010 Web Series Breaks Down
-
Red Bull, Google Declared Top Companies For Branded Social Video


![Here’s What Goes Into a $1,339,558 Web Series [INFOGRAPHIC]](https://www.tubefilter.com/wp-content/uploads/2013/07/video-game-high-school-infographic-660x389.jpg)


Newsletter
Subscribe for daily Tubefilter Top Stories
Trending Stories
- Blog Action Day: 'Big Ideas' from GOOD and Babelgum
- ExtraEmily’s suspension leads to calls to ban “streaming and driving”
- YouTube harkens back to original Instagram with photo post update
- YouTube joins Mark Rober’s $55 million mission to help teachers spread the good word of STEM
- Top 50 Most Viewed YouTube Channels Worldwide • Week Of 06/28/2026


Tubefilter, Inc


© Copyright 2007 - 2026 Tubefilter, Inc.