Talk show host Ellen DeGeneres is noted for staying on top of the Internet’s most topical memes, as well as having her finger on the pulse of a surging community of digital influencers. So it seems only natural that DeGeneres would be tapped by the YouTube Kids app to curate some of her favorite clips.
Several of the clips come from DeGeneres’ own show, naturally, such as when five-year-old presidential expert Macey Hensley met President Obama (below), while others, including the ‘apparently’ kid and this spunky little dance recital star, have become viral standards.
DeGeneres, who inked a development deal with YouTuber Tyler Oakley and announced a full slate for her digital network last week, isn’t the only big name to have been recruited by YouTube Kids in recent days.
Last Friday, Sesame Workshop, the nonprofit behind Sesame Street, launched a new YouTube channel called Sesame Studios, which will feature a roster of new digitally animated characters and shorts lasting between 30 seconds and five minutes. Its theme song was composed by YouTube star Todrick Hall. (Sesame Street’s original channel, featuring its beloved puppet characters and counting close to 2 million subscribers, will continue to exist.)
“You can create an unbelievable amount of content for YouTube for the cost of an hour of television,” Sesame Workshop president and CEO Jeffrey Dunn told NPR. “We believe that YouTube is going to be for this generation a lot like PBS is for prior generations. It is going to be where kids congregate and get access to media at some of their earlier stages.”
Creator Lilly Singh isn’t even a beauty guru, but the bold-faced vlogger — and star of the YouTube Red documentary A Trip To Unicorn Island — just inked her very first cosmetics deal.
In collaboration with the 20-year-old Smashbox beauty brand, Singh, who goes by the Superwomanmoniker on YouTube, is getting her very own lipstick shade fittingly dubbed Bawse. This is a term — slang for ‘boss’ — that Singh uses frequently in her vlogs, and encapsulates her own “indomitable, self-assured spirit,” according to Smashbox.
“At Smashbox Studios, we are always thinking outside of the box,” said founder and famed photographer Davis Factor in a statement. “When we started talking to Lilly Singh, about how she turns heads, reaches goals, and empowers her 8 million subscribers, we knew we had to collaborate.”
The limited edition deep red shade will be available in Smashbox’s Always On Matte Liquid Lipstick. Singh helped design the black and red packaging, which is covered in words like ‘resilient’, ‘bold’, ‘smile’, and ‘genuinely’. Priced at $24, Bawse is available at Smashbox.com and Sephora.com beginning today.
Singh teased that she was working with Smashbox on a secret project back in March. “I wanted to collaborate with Smashbox Cosmetics because they’re all about empowerment, about being your real authentic self, and that’s everything I stand for,” Singh said in a promo video (below).
Singh isn’t the first creator to launch a beauty product bearing her name. In 2013, Michelle Phan launched a makeup line called Eminspired by her fans, and, more recently, Carli Bybel launched a palette with BH Cosmetics.
Over the last decade on YouTube, creators and programmers have looked at various metrics to judge our online video successes and failures. And have sought out actionable insights that can help get more of the former than the latter. If you’ve been reasonably active on YouTube at all in the past 10 years, you know these metrics are always in flux. Figuring out what works and doesn’t work on YouTube – and the kinds of content the powers that be at YouTube want to work and not work on the platform – has been like trying to hit a rapidly moving target. It used to be that we could have our sights set on view counts and subscribers. Now it’s much more complex, subtle, and sophisticated.
That’s where Watch Time comes in.
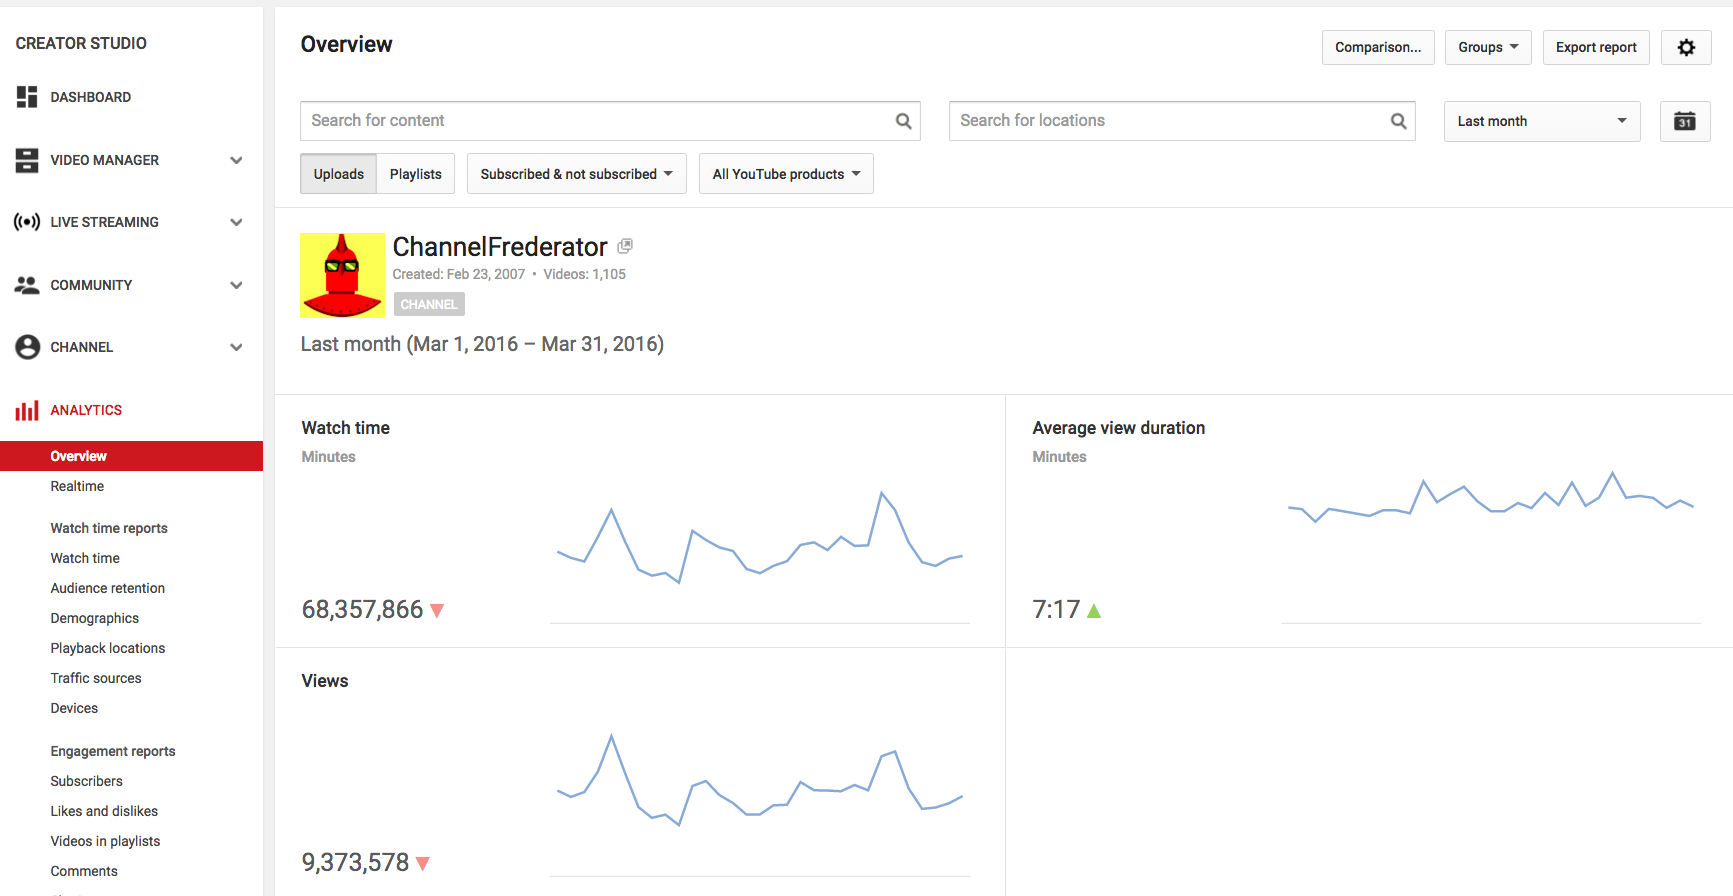
YouTube representatives and personnel regularly cite “Watch Time” as an “important metric to promote videos on YouTube.” It’s so important to YouTube, in fact, that the Watch Time analytics section is given prime positioning on any given creators’ YouTube Analytics dashboard. It’s pushed the “Views” graph down on the analytics page. Take a look.
Watch Time is the new black.
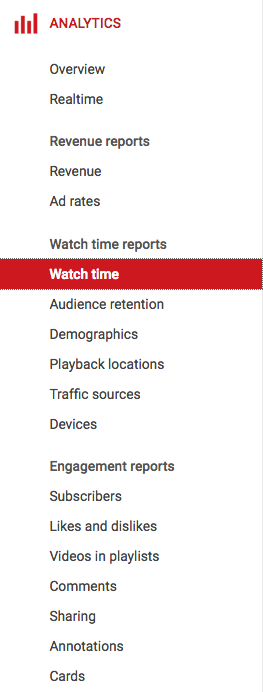
And YouTube even removed “Views” entirely from the side menu, putting Watch Time in its place.
Respect. The. Watch Time.
This, of course, means Watch Time is what YouTube wants us (the creators and programmers) to focus on most. Or, more importantly, if we want to be as successful as possible on YouTube we had better make Watch Time our #1 priority. But what exactly is Watch Time?
Watch Time = Views x Average View Duration
If you go by the numbers in the Analytics section on YouTube’s dashboard, Watch Time is simply the total number of minutes people have watched your videos. Take your “Views” and multiply them by your “Average View Duration” and you’ll get your “Watch Time.” That actually makes the metric not that valuable to creators from a programming standpoint. It’s just the direct product of two other metrics. You can’t impact, change, or optimize for your “Watch Time” without impacting, changing, or optimizing for its components. The metric is cool to have, I guess, but it’s kind of meaningless. However, Average View Duration is not.
…the average household also watches several hours… per day on their TVs. So for YouTube to become the most important media in more people’s lives, we’ve got a lot of growing to do.
It’s evident that YouTube wants to compete with television for your time and attention (and therefore ad dollars). In order to do that, YouTube optimizes all of its promotional video algorithms (the videos that you see when on YouTube’s search pages, in the Suggested and Recommended videos sections on the site, etc.) to feature videos that keep people watching longer. This is why Average View Duration is extremely important and the results of the algorithm tweaks have been impressive. But don’t just take Meyerson’s and my word for it, YouTube CEO Susan Wojcicki has touted the stat in the press, too, saying how overall Watch Time on the site has dramatically increased year over year.
Therefore, we as creators and programmers need to pursue “Watch Time” if we want to succeed on the platform. And that means optimizing for Views and Average View Duration. But there’s another caveat. When YouTube says “Watch Time” it doesn’t actually mean Minutes Watched (even though that’s what it says in analytics). There’s more to it than just Views and Average View Duration.
What YouTube really means by “Watch Time” is this: How often and for how long do your videos bring people to YouTube and keep them there? To figure that out we need to look at the four hidden metrics factored into “Watch Time.”
The Four Hidden “Watch Time” Metrics
There are four additional metrics beyond Views and Average View Duration that are factored into “Watch Time.” Check them out:
Session Starts is how many individual YouTube viewing sessions your videos start.
Session Duration is the total amount of time someone spends watching YouTube as a platform (Not just your videos and channel) and how that relates to your videos.
Session Ends are how many YouTube viewing sessions your videos end. (ie. When Viewers click off YouTube).
Upload Frequency is how often you’re uploading videos.
Disclaimer: Before I go further, I should state that while there is a lot of information about these metrics available online from both legit and shady YouTube SEO companies, I can find little in the way of official public comments or statements confirming or denying anything in regards to Session Time, Session Starts, Session Ends or Upload Frequency from YouTube itself.
However, in this guide from YouTube, on optimizing for Watch Time, it does state that:
“The algorithm for suggesting videos includes prioritizing videos that lead to a longer overall viewing session…”
The line is vague and doesn’t really stipulate the four individual metrics precisely. There is also this line from the YouTube Creator Playbook V3:
“YouTube optimizes search and discovery for videos that increase watch-time on the site…”
So, there’s really not a lot out there publicly or officially from YouTube to back up the importance of these metrics. It’s odd, because you’d think that YouTube wouldn’t be so secretive about its algorithm ranking factors, especially when it tries to tell people how to do well on their own site. There is zero data available in the Analytics Dashboard specifically designed to help creators and programmers determine what these metrics are (with the exception of upload frequency).
But I can say from personal experiences in public panels and presentations that I have repeatedly heard these four metrics (or variations of them) and their significant importance talked about by YouTube personnel. All that that said, I believe data from Channel Frederator backs up these metrics as being integral to the “Watch Time” and other algorithm equations. So, what is outlined below is how we at Frederator try to gain insight into these metrics, what impacts them, and how to optimize around them.
Also, please note all of these data points help paint a picture, but it’s not the whole picture. As with a lot of things about YouTube, there are undoubtedly hundreds, if not thousands of factors in play.
Session Starts
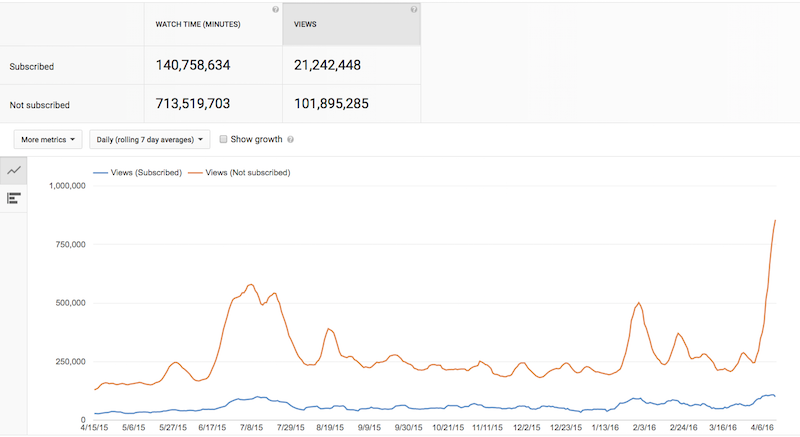
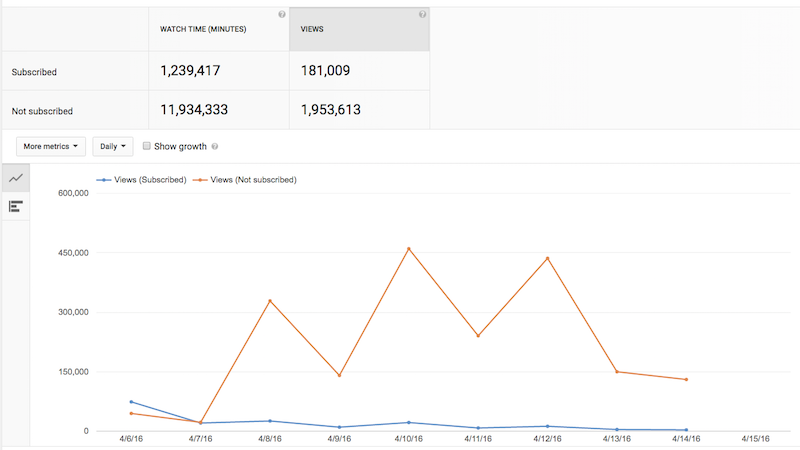
This graph below shows views of our channel’s subscribers vs. the views of those who aren’t subscribed.
Views: Subscribers vs. Non Subscribers
This was the first graph that gave us reason to investigate how views from subscribers impacted overall views and individual video performance. What we found was that subscription views in the first 24 – 48 hours of a video’s release seem to a be a key factor for the session starts metric. It may not be a direct factor, but we believe it impacts it.
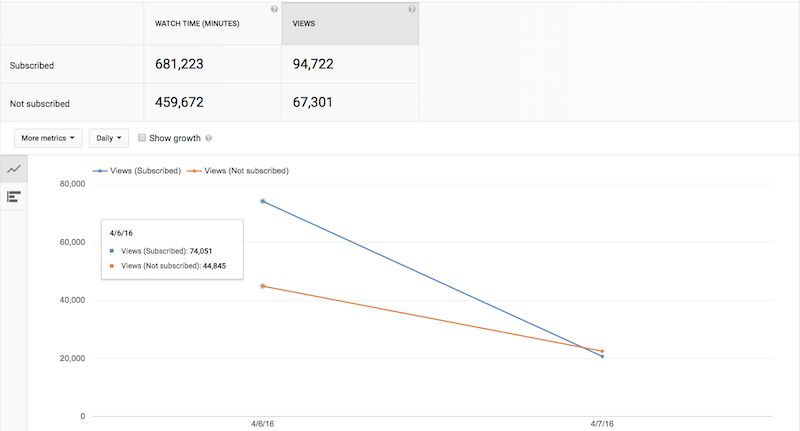
A great example of this is a video we released on Channel Frederator, “7 Cartoon Facts That Will Ruin Your Childhood.” In its first two days it generated 58.46% of its viewership from subscribers, getting 94,000 views from subs. This is roughly equivalent to 10% of our total subscribers (987,000 subs) at the time of its release. That views-to-subscribers percentage is very high for Channel Frederator:
Views in first two days of “7 Cartoon Facts That Will Ruin Your Childhood”
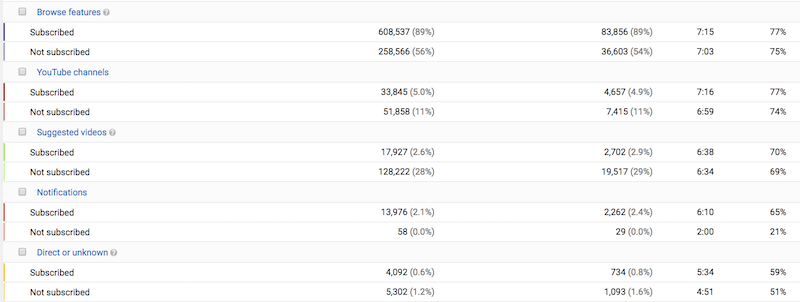
In our view, the numbers indicate this is a really strong video that brings people to YouTube and starts viewing sessions. The traffic sources for the video also reinforce this reasoning, as a large amount of the traffic sources are the YouTube homepage (e.g. the Browse and Suggest sections on the homepage, the Subscriptions tab, etc.) and our own channel:
Traffic sources for “7 Cartoon Facts That Will Ruin Your Childhood”
This early success in the first two days is likely one of the biggest contributing factors (along with Views and Average View Duration) to the success the video had over the next several days:
Views for the next several days of “7 Cartoon Facts That Will Ruin Your Childhood”
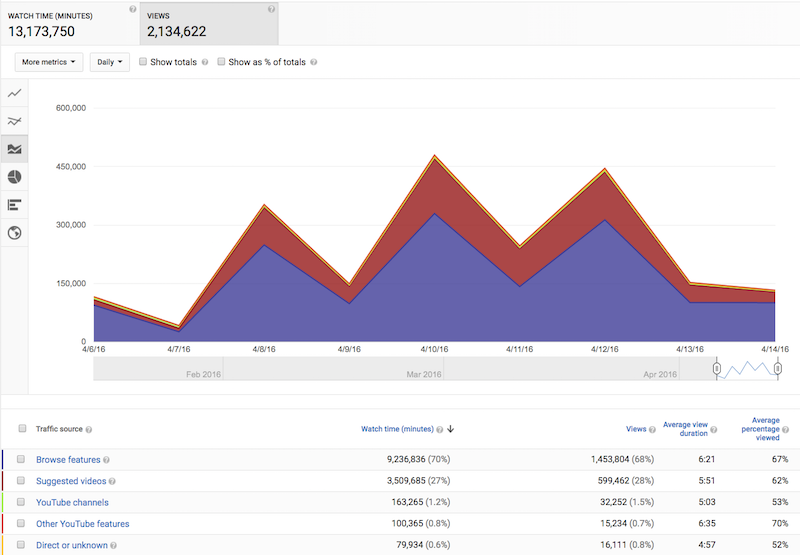
The traffic sources for these days are:
Traffic sources for the next several days of “7 Cartoon Facts That Will Ruin Your Childhood”
97% of the traffic over the ensuing days came from Browse and Suggested. Placement in those areas is basically 100% dependent on YouTube’s algorithm.
We investigated a number of our other videos at Frederator and found videos we considered high-performing videos typically generated between 45% and 65% of their first-day viewership from subscribers. They also generated views from subscribers equivalent to 5% or higher of our current subscriber count. Videos that performed outside this range were typically not high performers (with some outliers as exceptions).
Another way people have looked at this Session Starts metric is referred to as “View Velocity.” View Velocity is basically the concept that if a video gets a lot of views quickly after upload, YouTube looks at this as a significant indicator of a video’s immediate relevancy to a large swath of people. This is oftentimes seen when a video gets a lot of shares, embeds, or purchased views. This same concept can be applied to one’s own audience, too, which I believe all the data above supports. (And as you’ll see below, we’ve found the inverse to be true, too.)
One final note on Sessions Starts. This metric is also impacted by viewers who click on your video first in their YouTube session, either by going to directly to your channel or clicking on the video in their homepage feeds. This becomes extremely important, especially when it pertains to poor-performing videos. Our data for Channel Frederator indicates that if we upload a video and a small percentage of our viewers click to watch, YouTube will not only reduce how much they feature that video, they will also reduce how much they feature our other videos, by as much as 50%.
Our research gives us reason to believe that Session Starts is a significant factor in the YouTube promotional algorithms. Subscription viewership is obviously not the only source of Session Starts, but in lieu of having any sort of exact Session Starts metric in our YouTube Analytics, it can give you a meaningful view into how your content is performing according to the algorithms. .
Session Duration
The next big hidden metric we try to optimize for at Channel Frederator is Session Duration.
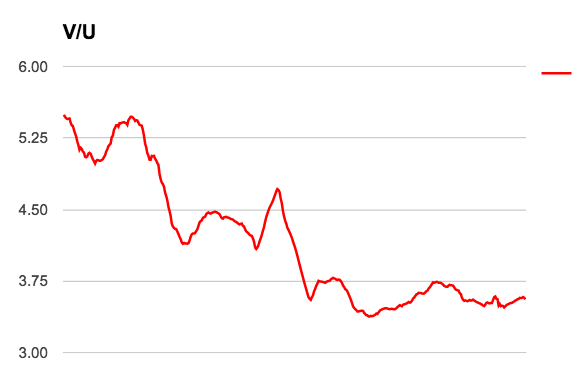
We try to piece this together by looking at our Views Per Unique Viewer. This metric actually doesn’t exist in YouTube Analytics, but you can get to it by dividing your Views by Unique Viewers. (However, this number doesn’t take into account Unique Viewers from the YouTube app and other non-browser viewership, as YouTube only accounts for “web only” Unique Viewers.) This is the graph of Channel Frederator’s 28-Day Rolling Average Views Per Unique Viewer since Jan 1st 2015:
Channel Frederator’s 28-Day Rolling Average Views Per Unique Viewer since January 1, 2015
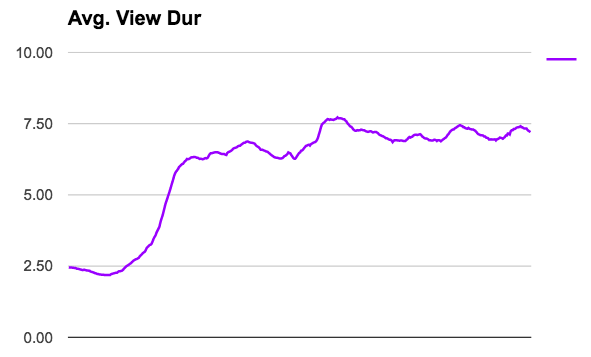
While that stat looks to be tanking, our Average View Duration has increased and stayed consistently high:
Channel Frederator’s 28-Day Rolling Average View Duration since January 1, 2015
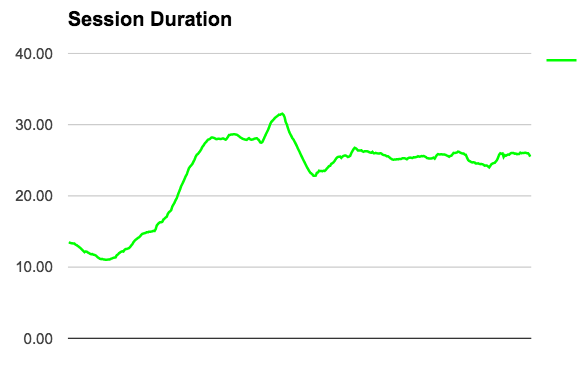
This means that our individual channel Session Duration has increased as well. We just take the Average View Duration and multiply it by Views Per Unique Viewer.
Channel Frederator’s 28-Day Session Duration since January 1, 2015
(Note that Session Duration here is a representative metric. It doesn’t tell us if all of those views happened successively or if they occurred over the course of the entire day. It’s also based on the aforementioned faulty Unique Viewers number. If you attempt to figure out your own Session Duration, just keep in mind that it’s kind of muddy.)
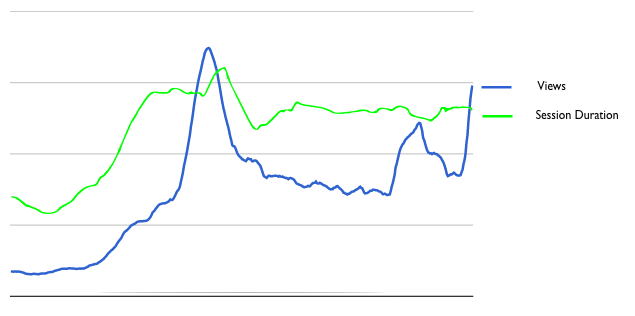
But now let’s compare these graphs to our Rolling 28 Day Viewership graph. Here’s where we start to see a bit more rhyme and reason to how all these metrics actually play out:
Channel Frederator’s 28-Day Session Duration vs, Views since January 1, 2015
As you can see there is some clear correspondence between Session Duration and Viewership. It’s still not a perfect match, however, and it doesn’t factor in Session Starts. But what the Session Duration metric does is help show us how long on average people are watching our videos on a given day. It also gives us a benchmark against which we can try to improve. There’s still no way to see how our Frederator videos impact Session Time across the entire YouTube site, so the best we can really do for this metric is try to drive up Average View Duration and Views Per Unique Viewer on our own content.
Session Ends
When we talk about Session Ends, we’re referring to videos that drive people off of the YouTube platform. There’s little to no data at all available around figuring out how this metric might look in Analytics. It’s unfortunate that this data doesn’t exist, as it would make programming choices on YouTube far easier.
For example, Channel Frederator has a merchandise store partner StashRiot (which is also owned by Frederator Networks). We want to promote this store and our merch heavily to generate additional revenue and revenue for channels in the Channel Frederator Network who have their own stores, so that our fans can show their love and support (and the channels can add to their bottom lines). However, we have no way of knowing how much promotion is too much from an algorithmic standpoint and have no idea what impact this promotion will have on our channel and videos.
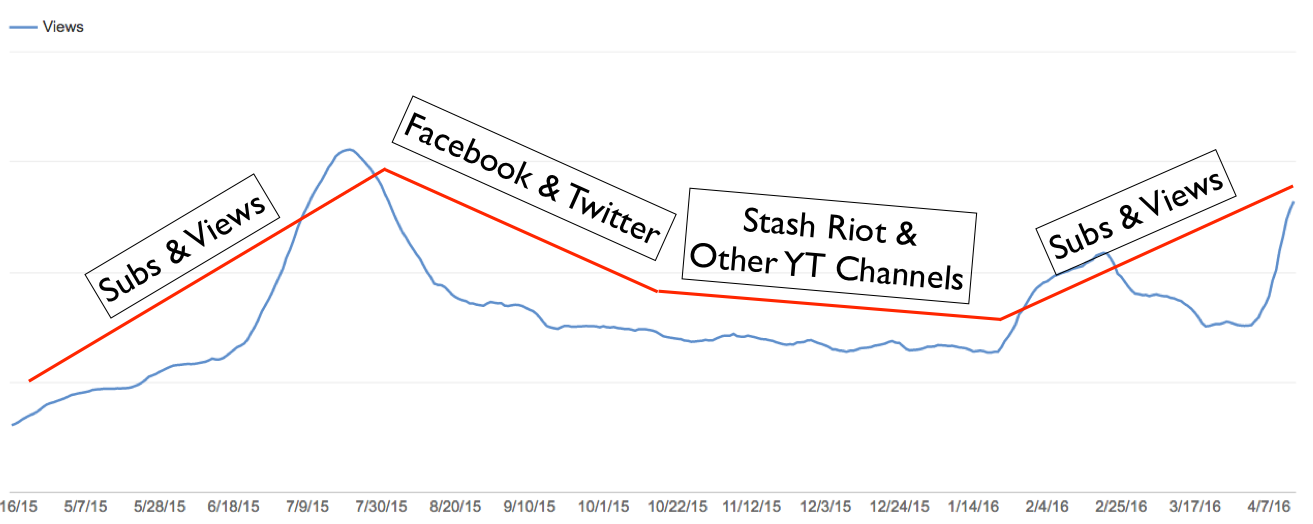
The data I do have around this is very superficial. This is a graph of Channel Frederator’s Viewership and what we were focused on from a messaging and marketing perspective in the majority of our videos at various points over the last 365 days:
Channel Frederator 28-Day Rolling Views vs. Promo
This timeline shows that as we shifted focus to driving people off of the YouTube platform our viewership dropped until we realigned our focus to keeping people on the YouTube platform. We don’t know if this had a direct or meaningful impact on Viewership, but the timing does match up.
One metric that does give some actual data around Session Ends is if you use annotations that link off the YouTube platform or a link shortener like Bitly for links in your description. This can at least help give a little insight into videos that are driving people off of YouTube.
Upload Frequency
There’s another item that impacts “Watch Time.” It’s a channel’s Upload Frequency.
Again, there’s not a lot publicly available directly from YouTube about this metric, but I can point to personal experience sitting in panels and presentations in hearing the importance of this metric spoken of many times. I was also able to unearth this from version 1.5 of the YouTube Creator Playbook: “More content will lead to more viewership and better ranking in algorithms.”
“Publishing regularly also provides more opportunities for your videos to surface in YouTube’s automated recommended and related video sections.”
On one hand, that’s a ‘no duh’ type of statement. More videos inherently means more opportunities to be featured. On the other hand, this speaks directly to YouTube’s stated mission of increasing Watch Time. The more an individual channel uploads, the more likely viewers are to come back again and again to see the new videos. In one YouTube panel I attended, we were shown a graph showing that the more times a viewer comes to YouTube in a given week, the more videos they watch in each individual session. Therefore, the reasoning goes, it’s within YouTube’s interest to feature and promote videos from channels that are capable of producing a large amount of content. If you need evidence for this look no further than every popular gaming channel that’s uploading multiple times per day.
It’s important to note how Upload Frequency interplays with the Session metrics. If a channel is uploading frequently that channel could be bringing people back to the platform often (Session Starts), giving them lots of content to watch (Session Duration), which keeps them from exiting the platform (Session Ends). However, if a channel is uploading frequently and people are NOT watching their videos, people do not spend a long time watching their videos, or the video causes people to leave the YouTube platform, this will be a “ding” against that channel’s performance for the Session metrics.
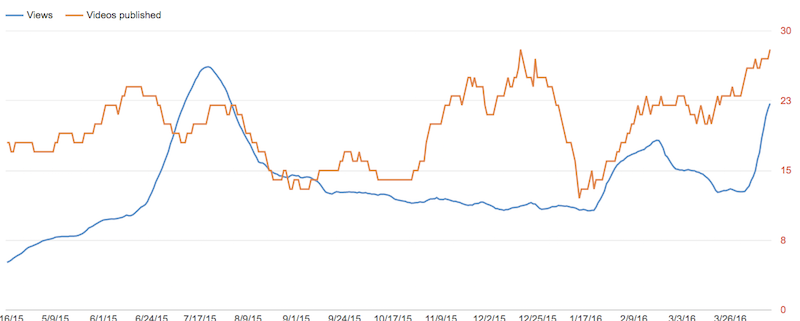
On Channel Frederator, we’ve seen this ourselves. This is the rolling 28-day totals for Channel Frederator over the last year comparing Viewership to Number of Uploads:
Channel Federator 28-Day Rolling Views vs. Videos Published
You can see as our Frederator uploads increased through April, May, June, and July of 2015, so did our viewership. Slowly, our average uploads dipped, and viewership followed. Then, beginning in late October we began uploading a lot of promotional videos, which received far less viewership in the first few days because our audience wasn’t clicking on them nearly as frequently. That speaks to a decrease in Session Starts, potentially a decrease in Session Duration, and an increase in Session Ends. In late December we cut these types of videos out and returned to mostly long form (7+ minutes) original videos while we slowly scaled our volume of uploads back up. As we’ve approached 30 uploads in a 28-day period, our viewership is rising again to our highest levels ever.
Conclusion
When YouTube and YouTubers use the term “Watch Time,” what they’re all talking about is a combination of many factors. The key metrics being Views, Average View Duration, Session Starts, Session Duration, Session Ends, and Upload Frequency. Since “Watch Time” is the primary metric the YouTube algorithms take into account, it’s essential that if you want to find success on the YouTube platform you optimize your programming strategy for the real meaning of “Watch Time.”
Matt Gielen is the VP of Programming and Audience Development for Frederator Networks. Matt oversees the teams building the largest animation network in the world, The Channel Frederator Network. He also leads the teams producing and programming Frederator Networks’ owned and operated channels on YouTube, Channel Frederator, The Leaderboard, and Cinematica. You can follow Matt on twitter @mattgielen. He’s also going to be giving some advanced seminars at Vidcon 2016 on both the Industry and Creator track with more insights and data based on this article.
Filed under: Articles, Channel Frederator, News, YouTube by Matt Gielen Comments Off on WTF Is Watch Time?! Or How I Learned To Stop Worrying And Love The YouTube Algorithm
Welcome to YouTube Millionaires, where we profile channels that have recently crossed the one million subscriber mark. There are channels crossing this threshold every week, and each has a story to tell about YouTube success. Read previous installments of YouTube Millionaires here.
This installment of YouTube Millionaires is brought to you by Epoxy.
YouTube’s community of female beauty vloggers is large and well-established, but at the same time, there is a smaller group of men who want to show off their looks, too. One of those “boy beauty” creators is Manny Mua, who has gathered a large audience by offering makeup tutorials to his viewers, sharing a few of his favorite cosmetic items, and exuding confidence all the way. In order to help Manny celebrate his recent million-subscriber milestone, we asked him a few questions about his digital success:
Tubefilter: How does it feel to have one million subscribers? What do you have to say to your fans?
Manny Mua: I feel amazing! It’s such a huge milestone that I am SO proud of! It makes me want to continue with what I’m doing and keep striving to be the best I can be.
TF: You’ve ascended very quickly since launching your YouTube channel. What do you has made you so popular with the YouTube audience?
MM: I think I grew quickly because there weren’t very many boys doing what I was doing at the time, and I think in order to grow on YouTube you have to be different and be yourself and I think I was doing pretty darn well at those 2 things 🙂
TF: What most excites you about being one of the most prominent male beauty vloggers on the Internet?
MM: What most excited me is being able to see younger kids, LGBT or not, being inspired by what I’m doing to be able to pursue whatever they want in life. It’s such an amazing feeling that is hard to describe.
TF: On the other hand, what would you say is the biggest struggle you have to deal with?
MM: The biggest struggle I would say is “turning it off.” There is no off switch with social media, you never get a break. It’s not a normal career that’s 9-5, this is full time 24/7 and that can be very difficult at times.
TF: Do you feel you have any obligation to educate your viewers about gender politics, or do you merely aim to entertain?
MM: Honestly I aim to entertain as well as educate. They go hand in hand for me. I want people to know that it’s okay to be a boy and wear makeup or do whatever they want. They don’t have to follow the “normal” rules of society. But I can also be funny and entertaining as well. I hope.
MM: Actually the idea came up cause I had SO many products from the same brand I thought, I wonder if I could do a full face with this brand. Once I realized I could I was like, HEY! I can do a couple of these, and show love to some different brands and products I wasn’t using as often.
MM: You’ll just have to subscribe to my channel and find out what’s next 😉 Good things! I promise you!
This installment of YouTube Millionaires is brought to you by Epoxy.
This installment of YouTube Millionaires is brought to you by Epoxy, the premier company that helps multi-platform creators and digital networks distribute videos, engage with fans, measure success, and grow their communities across the social web. Check out Epoxy’s new Sharing Studio, a place for quickly creating and distributing native social content from your YouTube channels.
YouTube and the National Football League (NFL) have expanded their partnership, the companies announced today, to bring 96 so-called “historic” football games in full to the video platform, as well as to make highlights from games this season available as they are in progress.
The new multi-year deal will build upon the NFL’s YouTube channel, which launched last year and has already garnered 900 million views. While the channel currently carries previews of games, highlights, and recaps — as well as news and fantasy football advice — the expanded partnership marks the first time that the NFL will post games in full. Three of the most memorable games from each of the NFL’s 32 total teams will arrive on the channel before the 2016 season starts in September, the company said in a press release.
And in addition to highlights posted while games are in progress, Google will display NFL videos in a “distinct box” at the top of search results, the company said, as well as similarly display kickoff times and broadcast information for every NFL game.
“YouTube has always been the home for sports highlights on the Internet, and we look forward to giving football fans around the globe access to even more of the content they love,” said Jonathan Zepp, YouTube’s head of North America direct content partnerships, in a statement.
“This expansion of our partnership will make it easier than ever for the millions of highly engaged avid and casual fans on YouTube and Google to discover and access an even greater variety of some of the most valuable content in the sports and entertainment business,” added Hans Schroeder, the NFL’s SVP of media strategy, business development, and sales.
As YouTube’s deal with the NFL expands, the league announced last month that Twitterhad won a contentious bidding war to live stream Thursday Night Football games this season for free and without authentication to its 800 million registered and non-registered users.
Gamer and fandom-centric network Machinima has announced two key hires within its programming division. Former Yahoo exec and digital video veteran Jason Dimberg has joined Machinima as SVP of programming and editor-in-chief — a newly-created role. He will be charged with leading “content development and programming across all of [Machinima’s] platforms and distribution channels,” according to a release.
At the same time, Machinima announced the promotion of Dave Shikiar from head of production to SVP of production. He will add oversight of all series currently in development and production to his existing responsibilities, which include managing studio operations and budgeting, the company said. Machinima’s output includes scripted action, animation, and comedy content, and Shikiar will also oversee the launch of new projects like Inside eSports, a daily news show set to debut on Verizon‘s go90 platform this summer.
Prior to Machinima, Shikiar served as the SVP of production at Zodiak LA, where he managed hit shows like Celebrity Wife Swap. Dimberg was the first general manager of Yahoo’s video platform, Screen, and has subsequently served as a consultant in the online video space.
Both Dimberg and Shikiar will report to Machinima CEO Chad Gutstein.
At its NewFronts presentation last week, Machinima — which has a talent network of 30,000 creators that boast over 150 millions viewers each month — announced an in-house gaming agency for brands and other ad tools to capitalize on the booming $910 million esports market.